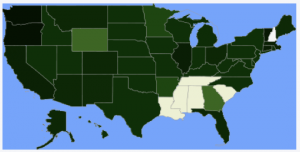
State Minimum Wage in the United States
The map below displays the variance in minimum wage across the 50 states. The darker the green indicates the higher the minimum wage salary. States with little or no color have no set minimum wage. The data used to form this chart is from January 2012 and can be found here.
Note: I apologize for any quality issues – I could not get the link for the image or the img tag for this chart to work so I had to resort to a screen shot.


Leave a Reply